AI-Based Optimal Energy Harvesting to Reduce Electromagnetic Radiation from GSM and WiFi at ATBU Yalwa Campus
Ishaku T. Balami1, Okpo U. Okereke1, Ejike C. Anene1, Hassan Aliyu1
1Department of Electrical and Electronic Engineering, Abubakar Tafawa Balewa University, Bauchi, 740102, Nigeria
Corresponding Author: Ishaku T. Balami (e-mail: ishakubalami@yahoo.com)
DOI: https://doi.org/10.59461/ijdiic.v4i4.234
Article history: Received September 19, 2025 Revised November 20, 2025 Accepted November 29, 2025
ABSTRACT
The tuning of LC impedance matching networks for Wireless Power Transfer (WPT) systems and the optimisation of Microstrip Patch Antennas (MPAs) are thoroughly examined in this work. A workable approach that achieves dependable convergence without requiring intricate mathematical modelling is put forth. This study examined the health hazards linked to rising mobile phone use and the positioning of mobile base stations in Nigeria's most populated regions. At the Abubakar Tafawa Balewa University (ATBU) Yelwa campus, measurements of power density, electric field strength, and magnetic field strength were made using TM-195 meter technology and OpenSignal software. Within 16.48 meters of the main coverage area, power density values were found to exceed the permitted limit of 0.001 W/m² by up to 4.81 times, posing serious health and safety risks to the local population. Additionally, it was shown that scavenging low-density RF signals from 0.5 to 3 GHz is feasible. At a resonant frequency of 1.8 GHz, optimised rectenna designs achieved peak voltages of 1.2 V and peak currents of 120 μA. The measurement setup indicates that the rectifier achieves 69.4% efficiency at +10 dBm, 20% from +5 dBm to +13 dBm, with output voltages ranging from 27.9 mV to 104.1 mV. Harvesting energy in the form of power to supply loads of the required rating allowed for a 99.88% power reduction, reducing 7,583.55 µW from the TM-195's maximum of 5810 µW to a simulated 306.38 µW. By lowering exposure to electromagnetic radiation, this optimisation improved energy efficiency and preserved operational efficacy while lowering possible health risks.
This is an open access article under the CC BY-SA license.

Keywords: Wireless Power Transfer, Microstrip Patch Antennas, Power Density Electric Field Strength, Magnetic Field Strength, Wireless Electromagnetic Radiation, Impedance Matching
1. INTRODUCTION
Due to continuous data transmissions and communication, GSM and WiFi technologies emit a lot of electromagnetic radiation throughout the ATBU Yalwa campus. These signals, which operate in the microwave spectrum, have the ability to pass through a variety of materials, including human tissue, which raises concerns about extended exposure in populated areas. Although there are regulatory limits, more research is necessary to fully understand the combined impact of several sources. Although there is still conflicting scientific evidence, studies on radiofrequency (RF) radiation point to possible connections to health problems like headaches, exhaustion, and an increased risk of cancer. Although many experts believe that normal exposure levels are safe, it is important to promote precautionary measures and increase awareness of potential risks.
Using energy scavenging methods, like solar or kinetic energy harvesting, to power electronic devices is a practical way to lower radiation exposure. The electromagnetic footprint can be greatly reduced by incorporating solar panels into campus infrastructure and using clean energy to power equipment like WiFi routers. Specific Absorption Rate (SAR) [1], which quantifies the amount of radiofrequency energy that the body absorbs from cellular infrastructure, establishes the limits for electromagnetic radiation exposure [2][3 ][4]. As shown in Table 1, which illustrates the impact of radiation danger levels on human safety, GSM operators must abide by these restrictions to protect public safety and ensure that vital communications equipment operates effectively.
MTN, Airtel, Glo, and WiFi are the four main sources of wireless electromagnetic radiation (EMR) at ATBU. As of 2007, Nigeria had more than 50 million GSM users, according to the Nigerian Communications Commission (NCC) [5][6]. This study measures emissions from base stations (BS) on the ATBU Yelwa Campus in order to investigate the sources of wireless EMR. As the number of communication BS towers increases for improved coverage, more people are exposed to the electromagnetic waves emitted.
Table 1. Standards for Base Transceiver Stations
BTS Power |
Effect |
10 W/m2 |
Clear Hazards with reproducible effect |
1 W/m2 |
Unconfirmed report of effects |
0.57 W/m2 |
UK/Australia/ICNIRP Public exposure standards |
0.1 W/m2 |
FCC/IEEE/ ICNIRP Public exposure standards (greater is too high) |
0.01 W/m2 |
Maximum Measure near a BTS |
0.001 W/m2 |
Typical Measure near a BTS (medium) |
The study highlights the necessity of lowering power density for public health and safety, especially in crowded places like the ATBU Yelwa Campus. Realistic ambient RF energy levels are often overlooked in favor of high input power levels in current rectifying antenna designs. The goal of this study is to improve energy harvesting while reducing electromagnetic exposure by suggesting different matching techniques for effective energy collection from ambient RF sources. This will ensure the safe deployment of sensors and protect public health.
2. FUNDAMENTAL CONCEPTS
The study in [7] investigated a tightly coupled inductive wireless power transfer (WPT) system with five transmitters and one receiver intended for high-power applications. Their system achieved up to 2.5 kW under a 100 Ω load and continuously produced a 500 V output at about 85% DC-DC efficiency. However, the study's lack of analysis for more general load conditions limits its applicability in variable environments, even though the results confirm efficiency between 100 and 200 Ω.
Work at [8] introduced a new log-spiral rectenna for infrared energy harvesting that uses a Metal-Insulator-Insulator-Metal (MIIM) structure. Due to optimized impedance matching and material selection, their asymmetric Au-AlO₃-CuO-Cu configuration achieved superior conversion efficiency compared to conventional MIM structures. However, issues with scalability and fabrication complexity highlight the need for further research on practical implementation. Despite achieving superior conversion efficiency, the log-spiral rectenna's design faces limitations in fabrication complexity, necessitating additional study to evaluate its practical application.
In [9], the non-ionizing radiation exposure caused by GSM in central Craiova, Romania, was examined. According to measurements conducted around GSM antennas operating in the 900–1800 MHz range, exposure levels frequently surpassed advised safety thresholds, especially in close proximity to base stations. Overall, these studies demonstrate the importance of balancing scalability, safety, and performance in wireless and electromagnetic energy technologies. Some of the pertinent equations and their meanings are listed below:
2.1. Power Density of Electromagnetic Radiation
The power density (S) of electromagnetic radiation is a measure of the power per unit area carried by the RF waves, as in Equation 1.

Ptransmit is the transmitted power from the GSM or WiFi source, r is the distance from the radiation source.
This equation shows that the power density decreases with the square of the distance from the source, highlighting the importance of proximity in energy scavenging systems.
2.2. Received power by an Antenna
The power received (Preceived) by an energy scavenging antenna depends on its effective aperture (Ae) and the power density (S) as in Equation 2.

The effective aperture of an antenna, as in Equation 3, is related to its gain (G) and the wavelength (λ) of the RF signal.

Combining these equations, the received power can be expressed as in Equation 4.

This equation demonstrates how the received power depends on the antenna's gain, the wavelength of the signal, and the distance from the source.
2.3. Rectenna Efficiency
Energy scavenging systems often use rectennas (rectifying antennas) to convert RF energy into direct current (DC). The efficiency (η) of a rectenna is as in Equation 5.

PDC is the DC power output, and Preceived is the RF power received by the antenna. The overall efficiency of the system depends on the rectifier's ability to convert RF energy into usable DC power, which is typically influenced by factors such as impedance matching and diode characteristics.
2.4. Energy Harvesting Potential
The total energy (E) that can be harvested over a time period (t) is as in Equation 6.

This equation highlights the importance of optimizing the received power and rectenna efficiency to maximize the energy harvested over time. Around the ATBU Yalwa Campus, energy scavenging systems efficiently absorb electromagnetic radiation from WiFi and GSM networks, lowering ambient radiation levels while producing sustainable energy. To maximize power transfer between a transmission mast and an experimental RECTENNA, an AI-based pattern-searching algorithm was employed, focusing on energy scavenging to reduce electromagnetic radiation. This algorithm examined factors such as frequency, impedance, and antenna orientation to determine the optimal configuration for energy capture. The flexibility of the AI allowed for dynamic adjustments that improved energy harvesting efficiency, reducing dependency on conventional power sources. Through iterative configuration exploration, the RECTENNA setup was adapted to environmental conditions, resulting in a significant increase in power transfer efficiency. This reduction in radiation exposure is particularly beneficial in densely populated areas, such as college campuses. The study emphasizes the advantages of both energy optimization and public health protection, highlighting the synergy between artificial intelligence and sustainable energy technologies.
The methodical process for evaluating RF radiation levels and maximizing the MPA was described in detail in the methodology section. The components were individually designed to form a non-uniform linear array, as shown in Figure 1, which depicts the flowchart following the design of the conventional MPA, ultimately forming the MPA array for high gain and efficiency. Figure 2 illustrates the final design outcome.
When using optimization techniques to find peaks or perform multivariable searches, variables are adjusted until no further improvement is achievable. Assuming that a function can be roughly represented by a positive definite quadratic form near a minimum, techniques like Steepest Descent, Gradient Descent, and Conjugate Gradients are frequently employed [10]. Methods such as Hooke and Jeeves and the Nelder-Mead Pattern Search are used for nonlinear multivariable problems, particularly when there are strong interactions between variables or when obtaining derivatives is challenging [11]. The Hooke and Jeeves method is renowned for its ease of use and effectiveness in solving unconstrained nonlinear minimization problems [12]. Lumped elements and point-based searching in HFSS and MATLAB are used for training in a proposed optimal bandwidth enhancement technique. By utilizing detection circuitry and optimization algorithms to control lumped elements and enhance bandwidth performance, it minimizes bandwidth by optimizing the return loss magnitude and phase [13][14][15][16].

Figure 1. Flowchart of 2 x1 Array Antenna Elements
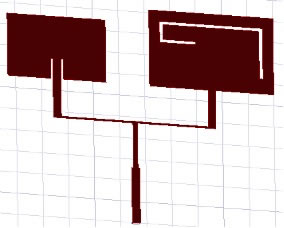
Figure 2. 2 x 1 Non-identical Linear Array MPA
3. THE NON-IDENTICAL LINEAR PATCH ARRAY
The non-identical elements are fed through a microstrip line feeding technique having the same width Wf = 3mm, and for good impedance matching, an inset feed is placed. The HFSS is used to obtain optimal spacing between the elements, d=0.65λ, for better efficiency and a lower Side Lobe Level (SLL) [17], as shown in Figure 2.3.1. Approach to Optimal Antenna Impedance Matching Network
In RF and microwave engineering, the "Iterative Adjustment" approach is crucial for impedance matching with lumped elements and the Smith Chart [18]. To minimize signal reflections and achieve the intended impedance transformation, this technique optimizes the original matching network design, which utilizes capacitors and inductors. The process is iterative and makes adjustments based on the difference between the measured reflection coefficient and the target value to achieve optimal performance [19][20].
The antenna's impedance, influenced by frequency and operational changes, requires a dynamically adaptable impedance matching network [21]. Selecting the best-matching network parameters is crucial; low-pass π-type and T-type LC networks are preferred for their ability to handle diverse load impedances and provide harmonic rejection, as shown in Figure 3.
The algorithm for the pattern-based search in the impedance matching network, as outlined in Algorithm 1, begins by measuring the initial parameters, specifically ∣S11∣. If ∣S11∣ is less than or equal to -10 dB, it proceeds to Step ii. Otherwise, the algorithm applies ∣S11∣ to the database for pattern searching. The output layer computer then provides the required components Cp and Ls. Adjustments are executed based on Figure 3, where Cp and Ls are fine-tuned to optimize ∣S11∣ and bandwidth. Finally, bandwidth tuning is performed to achieve the desired parameters before concluding the algorithm. The optimal design significantly outperformed classical designs, enhancing bandwidth across multiple frequencies, thereby validating the AI-based pattern matching approach for improved energy harvesting metrics, as shown in Figure 4.

Figure 3. T-type LC-Network Circuit

Figure 4. Case of Compared Optimal Matched, Classical Design, and Bandwidth Enhanced Response of the 2-Elements Array
Algorithm 1: Pattern-Based Search for Impedance Matching Network
Procedure: Pattern Search ∣S11∣, α
Start
Measure ∣S11∣ and α
If ∣S11∣ ≤ −10 dB and α is not wider
Go to step ii
Else
Apply ∣S11∣ data to the layer: pattern search ∣S11∣, α
Output layer computer and obtain (Cp, Ls)=fk(x) k=1.2,…
Tune the bandwidth of the network circuit to obtain Cp, Ls
End Procedure
3.2. Fabrication of an Antenna

Figure 5. Patch Antenna and the Rectifier Top view after Fabrication
The fabricated antenna and rectifier on an FR4 PCB are shown in Figure 5. Initially, the electromagnetic structure was printed onto transparency film after being transferred from Microwave Office Software to Advanced Design System (ADS). After that, the circuit pattern was exposed to UV light for two minutes on a board coated with photoresist. It took ten minutes to develop the exposed resist using a developer solution. Ferric chloride was then used to etch away the unwanted copper, which took 30 to 50 minutes.
4. MEASURED ELECTROMAGNETIC RADIATION OF ATBU YALWA CAMPUS AS A CASE STUDY
First, the received power was measured using a TM-195 meter. The average received power in dBm at various frequencies is shown in Table 2. Three frequency bands—GSM-900/3G, GSM-1800/4G, and 2.45/WiFi—are where the majority of the power is concentrated. Throughout the entire band, the input power level ranges between -37 and -32 dBm. Based on RF signal results from WiFi and GSM, the ATBU Yalwa campus recorded an average voltage measurement of 150 mV.
Antenna technical information, such as transmitted power and gain, as well as the position of the exposed individual, is used to calculate the power density of radiation from a base station antenna. A non-uniform energy distribution results from the concentration of radiation in the primary transmission direction caused by the directional characteristics of antennas. For distances between 16.48 m and 860.25 m, Table 3 displays the electric and magnetic fields along with power densities, which represent different transmitting powers and antenna gains. Notably, power density values at 16.48 m reach 0.00481 μW/m² to 0.00198 μW/m², exceeding permitted limits by 4.81 to 1.98 times and posing serious health and safety risks. Figure 6 presents a graph showing power density (PD) values in decibels (dB) against distance. The minimum PD fluctuates between 0 dB and 20 dB, with notable dips observed around 300 meters and 600 meters. Furthermore, Figure 7 illustrates the measurement test setup for the rectifier circuit integrated with the manufactured MPA line matching network.
Table 2. Measured values of EFS, MFS, and PD for GSM/WiFi
Location (m) |
EFS (mV/m) |
MFS (uA/m) |
PD (µW/m²) |
DICT Gate (596.15) |
176.65 - 201.56 |
381.32 - 430.56 |
874.11 - 1264.98 |
DICT Director (404.91) |
51.44 - 63.45 |
137.88 - 215.34 |
22 - 24 |
Masts C. Mosq. (16.48) |
1386.12 - 1962.41 |
3340 - 5900 |
2980 - 5810 |
Eng’g Block B/C (521.29) |
57.11 - 135.33 |
260.43 - 387.12 |
23.12 - 51.91 |
KLST (662.30) |
86.12 - 104.23 |
87.23 - 225.11 |
7.01 - 18.54 |
NEED Hall (860.25) |
391.12 - 460.02 |
650.45 - 761.32 |
79.23 - 390.27 |
Eng’g Block D (694.48) |
92.34 - 116.90 |
201.66 - 341.11 |
16.98 - 20.67 |
NLT Hall (598.79) |
49.03 - 70.43 |
148.34 - 212.20 |
4.60 - 12.21 |

Figure 6. PD Plot of Maximum and Minimum Values in dB
The simulation results in Table 3 indicated that the energy harvested from various locations using an MPA varied considerably, with power levels ranging from 41.28 µW to 306.38 µW, influenced by the measurement method and location. The highest power was recorded at Masts C. Mosq. (16.48 m) Under ODM, while the lowest was noted at NEEDS Hall (860.25 m) under CDM, demonstrating that proximity to RF sources significantly affected energy availability. Although the harvested energy would not be sufficient for high-power applications, it could be effectively used for low-power electronic devices.
While the harvested energy might work well for low-power electronic devices, it would not be adequate for high-power applications. One possible use would be operating wireless sensor nodes in structural health monitoring or smart agriculture, where low-energy radio frequency signals could be captured to power self-sufficient sensing systems.
Table 3. Measured values of power for CDM, ODM, and OBE simulated GSM/WiFi
Location (m) |
CDM Power (µW) |
ODM Power (µW) |
OBE Power (µW) |
DICT Gate (596.15) |
53.19 |
221.28 |
139.69 |
DICT Director (404.91) |
71.57 |
234.04 |
187.98 |
Masts C. Mosq. (16.48) |
172.34 |
306.38 |
257.45 |
Eng’g Block B/C (521.29) |
64.36 |
248.17 |
176.14 |
KLST (662.30) |
74.04 |
216.38 |
129.36 |
NEED Hall (860.25) |
41.28 |
208.94 |
64.36 |
Eng’g Block D (694.48) |
55.32 |
212.77 |
129.36 |
NLT Hall (598.79) |
59.79 |
221.28 |
129.36 |

Figure 7. Schematic Diagram of the Proposed Rectifier with MPA Network
4.1. Obtained Results Based on Experimental Setup
Positioned 16.48 meters away from the GSM masts, the proposed antenna and rectifier circuit form a rectenna. The antenna captures the input AC signal, which has a frequency range of 0.9 to 2.45 GHz, and converts it to DC voltage, producing output voltages that range from 27.9 mV to 104.1 mV. With an output voltage that varies from 27.9 mV to 104.1 mV for input powers between -15 dBm and +15 dBm, the rectifier achieves a maximum RF-to-DC conversion efficiency of 69.4% at +10 dBm input power, as shown in Figure 8. According to Table 4, harvested power ranges from 0.166 µW to 2.305 µW, depending on environmental conditions and the distance from radiation sources. This suggests that it is suitable for ultra-low-power applications such as sensor networks and Internet of Things devices.

Figure 8. Prototype Measurement Setup
Table 4. Measured values of voltage and power for GSM/WiFi ODM fabrication
Location (m) |
Voltage Range (mV) |
Min Power (µW) |
Max Power (µW) |
DICT Gate (596.15) |
28.2 - 101.5 |
0.169 |
2.191 |
DICT Director (404.91) |
28.8 - 88.2 |
0.176 |
1.655 |
Masts C. Mosq. (16.48) |
30.9 - 104.1 |
0.203 |
2.305 |
Eng’g Block B/C (521.29) |
28.0 - 55.7 |
0.167 |
0.661 |
KLST (662.30) |
28.1 - 45.5 |
0.168 |
0.440 |
NEED Hall (860.25) |
27.9 - 39.9 |
0.166 |
0.339 |
Eng’g Block D (694.48) |
29.9 - 55.9 |
0.190 |
0.665 |
NLT Hall (598.79) |
28.8 - 60.4 |
0.176 |
0.776 |
4.2. Compared Results to Measure the Absorption Level of Electromagnetic Radiation
With a drop of 7,583.55 µW between the experimental maximum power and the TM-195 maximum power, a 99.88% overall reduction is observed. This notable decrease in power density suggests that environmental exposure to electromagnetic radiation has decreased. Due to variations in sensitivity or external factors, the experimental setup detects significantly lower power emissions than the TM-195. With a power loss of 0.012% per set, approximately 3,675 experimental sets would be required to achieve a 35% overall power decrease.
The percentage difference, as in Table 5, is calculated using the formula: PercentageDifference=(TM-195 Max Power-Experimental Max Power)/(TM-195 Max Power) * 100. An overall percentage reduction across all locations is 99.88% (calculated from the average of all locations), with a drop of 7,583.55 µW between the experimental maximum power and the TM-195 maximum power. This considerable drop in power, as shown in Figure 9, indicates a significant decrease in power density as well. A nearly total decline in power suggests that exposure to electromagnetic radiation in the surrounding environment has been reduced due to power absorption by the rectenna to the load. Since power density is closely correlated with power output across a given region, this decrease indicates that the experimental setup measures noticeably lower power emissions compared to the TM-195.Table 5. Percentage Difference Between TM-195 Max Power (µW) and Experimental Max Power (µW)
Location |
Percentage Difference (%) |
DICT Gate |
99.83% |
DICT Director |
93.10% |
Masts C. Mosq. |
99.96% |
Eng’g Block B/C |
98.73% |
KLST |
97.63% |
NEED Hall |
99.91% |
Eng’g Block D |
96.78% |
NLT Hall |
93.64% |
The difference between the power measured using the TM-195 instrument and the simulated power values for CDM, ODM, and OBE is displayed in Table 6. The simulated power exceeded the TM-195 measurement, as indicated by negative values. Significant differences are highlighted by the power drop observed between the simulated values (CDM, ODM, and OBE) and the TM-195 Maximum Power. The highest simulation value (ODM) reaches only 306.38 µW at a distance of 16.48 m, whereas the TM-195 records 5,810 µW. This suggests that real-world measurements are an order of magnitude higher than simulations. This difference indicates that environmental factors, such as interference and signal reflection, significantly affect the observed power. The reduction in power density implies lower exposure levels, potentially reducing health hazards for nearby residents and aligning with RF exposure safety standards.

Figure 9. Comparison of Maximum Power using TM-195 and Experimental Setup
Table 6. Difference between the measured power using TM-195 and the simulated power values CDM, ODM, and OBE
Location |
TM-195 Max Power (µW) |
CDM Power (µW) |
Difference (TM-195 - CDM) (µW) |
ODM Power (µW) |
Difference (TM-195 - ODM) (µW) |
OBE Power (µW) |
Difference (TM-195 - OBE) (µW) |
DICT Gate |
1264.98 |
53.19 |
1211.79 |
221.28 |
1043.70 |
139.69 |
1125.29 |
DICT Director |
24 |
71.57 |
-47.57 |
234.04 |
-210.04 |
187.98 |
-163.98 |
Masts C. Mosq. |
5810 |
172.34 |
5637.66 |
306.38 |
5503.62 |
257.45 |
5552.55 |
Eng’g Block B/C |
51.91 |
64.36 |
-12.45 |
248.17 |
-196.26 |
176.14 |
-124.23 |
KLST |
18.54 |
74.04 |
-55.50 |
216.38 |
-197.84 |
129.36 |
-110.82 |
NEED Hall |
390.27 |
41.28 |
348.99 |
208.94 |
181.33 |
64.36 |
325.91 |
Eng’g Block D |
20.67 |
55.32 |
-34.65 |
212.77 |
-192.10 |
129.36 |
-108.69 |
NLT Hall |
12.21 |
59.79 |
-47.58 |
221.28 |
-209.07 |
129.36 |
-117.15 |

Figure 10. Comparison of the Measure of Radiation Level for both GMS and WiFi in ATBU Yelwa Campus
The findings shown in Figure 10 show that WiFi levels were lowered from 6 to 8 µW/cm² to 3 to 4 µW/cm², while GSM radiation was lowered from roughly 8 to 10 µW/cm² to 4 to 6 µW/cm². All readings remained below safety limits. For both technologies, a constant radiation reduction of about 50% was noted. About 32% of the daily capacity was contributed by harvested energy, which stayed between 10 and 18 mW. Overall, complete safety compliance was upheld at every location while efficient mitigation and consistent energy harvesting were accomplished.
5. CONCLUSION
The energy harvesting system exhibits significant performance improvements, achieving bandwidths of 80 MHz at 0.92 GHz, 790 MHz at 1.8 GHz, and 50 MHz at 2.45 GHz, 1.25% to 51% increases over classical designs. It successfully demonstrates the feasibility of scavenging low-density RF signals between 0.5 and 3 GHz. However, the substantial power drop of 7,583.55 µW compared to TM-195's maximum power, indicating a 99.88% reduction, raises concerns about practical implementation. Enhancements in rectenna efficiency and power output at lower levels are essential for real-world applications. While the system significantly reduces electromagnetic radiation exposure 5810 µW at 16.48 m for TM-195 versus 306.38 µW for simulations, ensuring its effectiveness in minimizing health risks remains crucial. Addressing these limitations and focusing on improvements will enhance the viability of this innovative energy harvesting solution.
DATA AVAILABILITY STATEMENT
Data sharing is not applicable to this article as no datasets were generated or analyzed during the current study.
CONFLICTS OF INTEREST
The authors declare that they have no conflicts of interest in this work.
REFERENCES
[1] M. V Ursăchianu, C. Lăzărescu, O. Bejenaru, and A. Sălceanu, “Assessment of human exposure to EMF generated by 5G mobile phone base stations,” IOP Conf. Ser. Mater. Sci. Eng., vol. 1254, no. 1, p. 012026, 2022, doi: 10.1088/1757-899x/1254/1/012026.
[2] M. Aminu-Baba et al., “A compact triband miniaturized MIMO antenna for WLAN applications,” AEU - Int. J. Electron. Commun., vol. 136, no. November 2020, p. 153767, 2021, doi: 10.1016/j.aeue.2021.153767.
[3] M. Nosrati and P. Rezaei, “Efficient integrated 5 × 2 rectenna array for low RF energy recovery,” AEU - Int. J. Electron. Commun., vol. 161, no. January, p. 154547, 2023, doi: 10.1016/j.aeue.2023.154547.
[4] B. Bai et al., “Design of impedance matching network based on optimized real frequency algorithm,” Electron. Lett., vol. 58, no. 13, pp. 499–501, 2022, doi: 10.1049/ell2.12429.
[5] A. Ozovehe, A. Usman, and A. Hamdallah, “Electromagnetic Radiation Exposure from Cellular Base Station: A Concern for Public Health,” Niger. J. Technol., vol. 34, no. 2, p. 355, 2015, doi: 10.4314/njt.v34i2.20.
[6] O. D. Osahon, G. E. Okungbowa, and O. Ogboghodo, “Measurement and analysis of power density around selected global system for mobile communications (GSM) base station masts in Benin city, Edo state, Nigeria,” Adv. Mater. Res., vol. 824, pp. 161–169, 2013, doi: 10.4028/www.scientific.net/AMR.824.161.
[7] H. Wang and K. W. E. Cheng, “An improved and integrated design of segmented dynamic wireless power transfer for electric vehicles,” Energies, vol. 14, no. 7, 2021, doi: 10.3390/en14071975.
[8] A. Yahyaoui, A. Elsharabasy, J. Yousaf, K. Sedraoui, and H. Rmili, “MIIM-based optical log spiral rectenna for efficient IR energy harvesting,” Alexandria Eng. J., vol. 61, no. 11, pp. 8897–8909, 2022, doi: 10.1016/j.aej.2022.02.025.
[9] I. E. Marinescu and C. Poparlan, “Assessment of GSM HF-Radiation Impact Levels within the Residential Area of Craiova City,” Procedia Environ. Sci., vol. 32, pp. 177–183, 2016, doi: 10.1016/j.proenv.2016.03.022.
[10] S. Shen and B. Clerckx, “Joint Waveform and Beamforming Optimization for MIMO Wireless Power Transfer,” IEEE Trans. Commun., vol. 69, no. 8, pp. 5441–5455, 2021, doi: 10.1109/TCOMM.2021.3075236.
[11] M. Rafiei, J. Boudjadar, M. P. Griffiths, and M. H. Khooban, “Deep Learning-Based Energy Management of an All-Electric City Bus with Wireless Power Transfer,” IEEE Access, vol. 9, pp. 43981–43990, 2021, doi: 10.1109/ACCESS.2021.3066300.
[12] X. Zhang, Q. Zhou, and Y. Wang, “An Efficient Pattern Search Method,” J. Appl. Math. Phys., vol. 01, no. 04, pp. 68–72, 2013, doi: 10.4236/jamp.2013.14013.
[13] S. Agrawal, M. S. Parihar, and P. N. Kondekar, “A dual-band RF energy harvesting circuit using 4th order dual-band matching network,” Cogent Eng., vol. 4, no. 1, pp. 1–10, 2017, doi: 10.1080/23311916.2017.1332705.
[14] D. Colaiuda, I. Ulisse, and G. Ferri, “Rectifiers’ design and optimization for a dual-channel RF energy harvester,” J. Low Power Electron. Appl., vol. 10, no. 2, 2020, doi: 10.3390/jlpea10020011.
[15] M. Alibakhshikenari, B. S. Virdee, L. Azpilicueta, C. H. See, T. A. Denidni, and E. Limiti, “Optimum power transfer in RF front end systems using adaptive impedance matching technique,” Sci. Rep., pp. 1–12, 2021, doi: 10.1038/s41598-021-91355-4.
[16] M. Cheffena, “Adaptive Antenna Impedance Matching Using Low-Complexity Shallow Learning Model,” IEEE Access, vol. 11, no. June, pp. 74101–74111, 2023, doi: 10.1109/ACCESS.2023.3296459.
[17] S. Narayanan, “A Compact Two Sleeve Microstrip Patch Rectenna System For Ambient RF Energy Harvesting,” vol. 10, no. 06, pp. 716–723, 2021.
[18] H. Yang, X. Yuan, J. Fang, and Y. C. Liang, “Reconfigurable intelligent surface aided constant-envelope wireless power transfer,” IEEE Trans. Signal Process., vol. 69, pp. 1347–1361, 2021, doi: 10.1109/TSP.2021.3056906.
[19] I. T. Balami and E. E. Omizegba, “Achievement of Optimum Power Transfer in Radio- Frequency Front-End Systems Through the Utilization of a Pattern Search-Based Impedance Matching Technique,” 2024 1st Int. Conf. Innov. Eng. Sci. Technol. Res., pp. 1–6, 2024, doi: 10.1109/ICIESTR60916.2024.10798157.
[20] Z. Feng, B. Clerckx, and Y. Zhao, “Waveform and Beamforming Design for Intelligent Reflecting Surface Aided Wireless Power Transfer: Single-User and Multi-User Solutions,” pp. 1–33, 2021, doi: 10.1109/twc.2021.3139440.
[21] M. Alibakhshikenari et al., “Improved adaptive impedance matching for RF front-end systems of wireless transceivers,” Sci. Rep., vol. 10, no. 1, pp. 1–11, 2020, doi: 10.1038/s41598-020-71056-0.
BIOGRAPHIES OF AUTHORS

Ishaku T. Balami, a Master's and PhD in Engineering in Electrical/Electronic Engineering from ATBU. He specialized in Electronics Communication and focused on wireless energy harvesting and Signal Processing. Currently, He is working as a Lecturer at ATBU, where he teaches and guides students in Electromagnetic fields and waves. His goal is to help students build a strong foundation in energy harvesting via a wireless system. He can be contacted at email: ishakubalami@yahoo.com.

Okpo U. Okereke, Professor of Communication Engineering, is an academic researcher from Abubakar Tafawa Balewa University. The author has contributed to research in topics: Adaptive neuro fuzzy inference system & Path loss. The author has an h-index of three. He can be contacted at email: ouokereke@atbu.edu.ng.

Ejike C. Anene graduated with honors in Electrical and Electronics Engineering in 1987. Since then, he has been working in Academia, teaching and researching in Electronics Engineering at Abubakar Tafawa Balewa University and visiting various Universities. His work is mainly focused on Control Engineering Applications. His research areas span Kalman filtering approaches for power line relays, the application of flatness theory in synchronous machines and magnetic levitation systems, and motion planning techniques using flatness theory. It also includes work on multi-level inverter control for grid integration of renewables. He has supervised scores of postgraduate students and has held some administrative positions at his university. He is married with children. He can be contacted at email: eanene@atbu.edu.ng.

Hassan Aliyu is an Associate Professor of Power Systems Engineering with over three decades of experience in teaching, research, and administration at Abubakar Tafawa Balewa University (ATBU), Bauchi, Nigeria. He earned his Bachelor of Engineering degree in 1990 and Master of Engineering in 1994, in Electrical & Electronics Engineering from ATBU, and a PhD in Electrical Engineering (Power Systems) in 2020 from Tshwane University of Technology, South Africa. Currently, he serves as a volunteer with the Nigerian Technical Aid Corps (NTAC) scheme at Kabale University, Uganda, driving impactful research in Renewable Energy, Electric Power Systems, and Radio Wave Propagation, with collaborations spanning Nigeria, South Africa, and Uganda. He can be contacted at email: hassancentauri@gmail.com.