Remote Health Parameter Monitoring Using Internet of Things: An Edge-Cloud Centric Integration for Real-time Reporting
Chukwuemeka Obasi1, Braimoh Ikharo1
1Department of Computer Engineering, Edo State University Uzairue, Auchi, Nigeria
Corresponding Author: Chukwuemeka Obasi (e-mail: chukwuemeka.obasi@edouniversity.edu.ng)
DOI: https://doi.org/10.59461/ijdiic.v4i1.163
Article history: Received January 13, 2025, Revised February 21, 2025, Accepted March 13, 2025
ABSTRACT
Monitoring human health has become a phenomenon that integrates cutting-edge technology, which is capable of provisioning updated and sufficient data information to support human well-being in general. A key component of healthy living is preventing disease and health issues in general. The development of Internet of Things (IoT) technology has greatly improved a number of industries, including healthcare. In this study, a unique four-layered architecture for a Remote Health Parameter Monitoring (RHPM) system that uses sensors to monitor blood oxygen concentration (SpO2), body temperature (BT), and heart rate (HR) is presented. The system incorporates edge and cloud computing technologies. Data preprocessing at the edge is performed using an Arduino ESP8266 board and transmitted to cloud servers via the Message Queuing Telemetry Transport protocol for real-time processing and visualization. The testing of the system returned very high accuracy, yielding Mean Absolute Percentage Error (MAPE) values of 2.32%, 2.94%, and 3.43% for BT, SpO2, and HR, respectively. Another metric of evaluation was the R-squared value, which yielded 98% for BT and 97% for both SpO2 and HR, respectively. This paper integrates Support Vector Machine models, which enhances its predictive capability and achieves a cross-validation accuracy of 94.7%. The result indicated that the RHPM system is able to improve the well-being of the patient through early detection and informed preventive health management. Health institutions can tap into the real-time characteristics of the health parameters being monitored in fueling medical decision support systems for improved customer satisfaction and the delivery of modern healthcare solutions.
This is an open access article under the CC BY-SA license.

Keywords: Edge Cloud, Internet of things, Remote health monitoring, Real-time Health Data, Wearable sensors
1. INTRODUCTION
IoT and its applications have been viewed as one of the most rapidly growing concepts for the last few years in industries such as engineering, healthcare, commerce, agriculture, and environmental management. A number of linked devices that are equipped with sensors and embedded systems which have the ability to collect, process and distribute data from their ambience compose Internet of Things networks [1][2]. Smart manufacturing, smart cities, smart agriculture, and—most intriguingly—smart health are just a few of the remarkable new applications that have emerged as a result.
In order to prevent a breakdown, improve efficiency, and lower maintenance costs, monitoring health entails taking ongoing, controlled steps to assess certain aspects of a system's operation [3][4]. Depending on the objectives of the monitoring operations, they may be conducted in a specific region of interest or in another location. Achieving Sustainable Development Goal (SDG) number 3, which aims to encourage healthy living for all of its members and improve the average well-being of people, depends on the monitoring of human health in particular. Health monitoring services are acknowledged by the World Health Organization (WHO) as being crucial for handling public health emergencies like the COVID-19 pandemic [5][6]. In Addition, the achievement of SDG 3 depends on a number of factors, including illness management and in-house care [9] and [10], intensive care monitoring [8], public health monitoring and reporting, occupational health monitoring [7], soldiers' health on the battlefield, etc. Patients who depend on traditional health monitoring systems have to seek medical attention sometimes in institutions, which is costly and time-consuming. In Addition, these systems could not provide real-time data that would minimize their capability to manage and prevent health problems. IoT presents a game-changing answer in allowing remote health monitoring through networked devices that gather, process, and send health data in real-time. Efficiency and reliability need the appropriate integration of edge and cloud computing technologies, which, unfortunately, is mostly missing in current IoT-based health monitoring systems. Moreover, most of them also suffer from well-marked deficiencies in performance evaluation measures that could ensure accuracy and dependability compared with traditional medical equipment.
Aiming for ease of use with a four-layer streamlined structure, this paper suggests a novel RHPM system on both the technologies of edge computing and cloud. The proposed advanced sensors monitor several health factors like blood pressure, heart rate, and oxygen saturation of the patient using advanced sensors in the proposed system and transfer the data interpreted and displayed utilizing cloud resources. It targeted developing an integrated remote health monitoring system capable of early sickness detection and, correspondingly, appropriate treatment.
The contributions provided by this study are as follows:
1. A new, advanced four-layer architecture comprising sensors, cloud computing for various data processing and storage, edge computing for preprocessing, and a simple user interface for real-time healthcare provider monitoring.
2. Our system has been subject to steady validation and testing, which resulted in low MAPE and high enough R-squared values to prove that this is a system reliable enough to be compared to hospital equipment.
3. Due to cloud integration, users can now visualize their data in real-time and receive notifications regarding it for further analysis or to take any action based on their health state.
4. Because the MQTT protocol is utilized for communications between the edge and cloud levels, the system may also be made more flexible and scalable.
Section 2 of the remaining portion of this paper reviews relevant research on Internet of Things-based health monitoring systems. The technique is described in Section 3, which also covers the implementation details and system design. The results collected are discussed and provided in section 4. The conclusion and future study direction are presented in section 5, which is the final portion.
2. LITERATURE REVIEW
In 2020, [4] conducted bibliometric research, which found that the phrase "health monitoring" was included in 42% of 13,500 search results. This indicates that a great deal of research has been done on the topic of health monitoring, which involves the use of integrated technologies and tools to constantly check and generate data on users' health conditions. The idea is summed up as Health 4.0, which is the use of IoT to remotely communicate data over the cloud and monitor vital indicators. Wearable sensors make up this network of things. Wearable technology accounted for the majority of sensor-based health monitoring systems reported in the literature [11]. The study [12] set up a sensor array that included an accelerometer, oximeter, pulse rate, and electrocardiogram (ECG) sensors to track various health metrics via a safe cloud platform. Similarly, [13] used a Raspberry Pi to create a health parameter monitoring (HPM) system based on three parameters: temperature, ECG, and pulse rate. Through the use of a sensor interfaced with the Raspberry Pi controller, the health parameters were gathered and then sent over Hypertext Transfer Protocol (HTTP) to a server. From there, they were disseminated to the relevant parties via a Short Message Service (SMS) dashboard. However, there was no data analytics component in the system. This work was comparable to that of who used a Raspberry Pi to create a system that was comparable to this one and could connect with a smartphone. In the study of [14], BT, HR, and saline levels were tracked using Raspberry Pi.
Vital signs of patients in severe situations, such as coma, were tracked in studies conducted in [15][16] and [17]. An SMS would be issued to the caretakers and the medic if the vitals deviated from the threshold levels. However, neither a cloud interface nor a system that would do predictive analysis on the gathered data were there. In [18], real-time BT monitoring was accomplished with an Arduino and DS18B20. Additionally, it may identify deviations from the threshold and notify medical professionals so that prompt control actions can be implemented.
In the research in [20], wearable Internet-of-things (IoTs) monitoring systems were explored in relation to the challenges associated with several of them. Components such as system functionality, security and privacy issues, enabling technologies, and the prospect of integration and applications were addressed. The study prefigured the growth of e-health ideas with the superior performance of wearable devices in the health care service delivery in no distance time. This work is sine qua non to the realization of these said objectives.
In conclusion, the accessible literature demonstrated that several articles have been written on remote health monitoring. The study of performance evaluation that contrasted the measurements of standard measuring equipment with their suggested parameter measurements, however, has not received enough attention from state-of-the-art research, according to the list of existing literature. Using metrics such as the MAPE and the R-squared value for the standard and measured parameter values, it is necessary to identify the IoT systems intended to monitor health parameters. Furthermore, the reviewed literature did not sufficiently address the issues of cloud-based data analytics.
3. METHODS
Figure 1 illustrates the four-layer architecture followed by the proposed RHPM system, which will enable the efficient gathering, processing, and analysis of health data in real-time. It will be an integrated solution for remote health monitoring, with advanced sensors, as well as levels of edge and cloud computing, together with an intuitive user interface.
3.1. Architecture of the System
The architecture of RHPM is a four-layer one:
Sensing Layer: It consists of the advanced SpO2, HR, and BT sensors. These will be designed in a wear-and-forget style to attach on the body, hence offering the capability for continuous patient monitoring in a very non-intrusive fashion.
Edge Computing Layer: Data collected at the sensing layer is transmitted to the closest edge device (a specialized gateway or smartphone) for additional processing. These activities involve fundamental analytics, data smoothing (aggregation), and data reduction (compression and filtering). This, in turn, facilitates bandwidth efficiency and speeds up operations by reducing the size of the data sent to cloud storage.
Communication Layer: This guarantees that Wi-Fi will be used as the communication channel between the server and the edge device due to its reasonable bandwidth, power efficiency, and range. Normally, Wi-Fi can cover distance from 100 to 300 meters which is enough for most systems for home- based and facility-based health monitoring. The MQTT protocol is used as a means of communication because it is lightweight, economically reasonable, and suitable for handling dense short bursts of data, which are a feature of the Internet of Things.
Cloud Computing Layer: Data processed by the edge device is transferred to cloud servers via secure links. The cloud layer's strength lies in its ability to provide space, valuable data treatment, and advanced analysis in Addition to timely data presentation within the graphics. It also provides the glue required to combine various machine-learning algorithms to identify abnormal behaviours and send signals to the appropriate authorities.

Figure 1. Architecture of RHPM
3.2. Data Processing and Flow
The two sensors that are required for detecting the needed health-related data in this system are the SpO2 sensor for measuring HR and SpO2 data and an infrared temperature sensor, MLX90614, for measuring BT. The data captured by these sensors were delivered to an edge processor with inbuilt Wi-Fi on an ESP8266 board. Next, data preparation in the form of filtering, compression, and aggregation through the nth-term moving average technique, as described in Equation 1, was performed. This was the initial preparation of data in such a way that noise was reduced and redundant data dropped before actual transmission to the cloud with efficiency and dependability regarding data handling.

Where,
x = sample sensor data
n = moving average term
Because of its lightweight design and effective functioning, even with limited bandwidth, the MQTT protocol was used for data transfer. The IoT Edge transmits data to a topic on the MQTT Server (Mosquito) using a publish-subscribe mechanism. Data from the edge layer was published as a topic, while the web dashboard interface subscribed to the topic to be able to access and track the health data for analysis and real-time monitoring.
Thirdly, the aggregated data was stored on the cloud and analyzed on the cloud. The analytics phase was achieved by deploying machine learning algorithm for the prediction of probable health condition. The ultimate result of the system is alert generation and real-time monitoring. Healthcare providers can have a user-friendly dashboard showing processed data in real-time. If any metric crosses the predetermined criteria, alerts are immediately triggered, thus enabling prompt intervention and proactive healthcare management.
3.3. System Implementation
For this implementation, Figure 2 shows a circuit schematic highlighting the interface of the sensors with an ESP8266 board.

Figure 2. Schematics of the RPM
The software development with C-based ESP8266 using the Arduino programming IDE became a starting point for developing software using Python language targeting the Edge-cloud components. The MQTT was also implemented at the Edge end, first by serializing and formatting the data string using the JSON object form. It was published on the "Health_Parameter" topic. The cloud side interfaces with this topic subscription through an API. The data was then converted back from JSON object form into its original format.
The SVM technique was utilized to define a hyperplane (Equation 2) between the dataset's healthy and sick classifications, enabling real-time monitoring. This was accomplished by reducing the distance between the two categories' closest data elements (support vectors), which allowed for efficient classification using Equation 2.

Subject to
yi (w.x+b)≥1for i=1,…,n
Where,
w = weight vector w
yi= class label (healthy, unhealthy)
b = bias term
x = input feature vector
ξi = set of slack variables
C = regularization parameter
Secondly, SVM resolved its dual variables by utilizing the Lagrangian of the primal problem, as formulated in Equation 3 [19].

Where αi is the Lagrangian multiplier
Thirdly, SVM employed the decision function, as expressed in Equation 4, to make predictions on new instances x.

The SVM model was built with the hyperparameter settings in Table 1.
Table 1. SVM Parameter Tuning
Hyperparameter |
Value |
Regularization parameter, C |
1.0 |
Gamma |
Scale |
SMOT (random state) |
42 |
Cross-validation, cv |
5 |
Standard Scaler |
Standardized feature |
Initially, the developed RHPM was used to collect 50 sample data from volunteers following ethical guidelines. These sample data were recorded. Clinical records were also used to compare data in order to formulate labeled classes for the complete dataset.
To avoid biase, the dataset was enhanced by augmentation, and finally we had a total sample of 500 data samples in the dataset. The next stage was reprocessing, which involved cleaning and engineering the data, and eliminating the class imbalance through SMOTE.
Lastly, the model was developed using SVM because of its record of high performance on linear and nonlinear classification tasks. The model was built using the hyper parameters listed in Table 1. During model training with 80% of the dataset, cross-validation of the model's parameters was performed, and further regularization was done to reduce over-fitting. Some of the performance indicators assessed were accuracy and precision, recall, and F1 score, all of which showed the reliability of the SVM when operating on unknown data.
The trained SVM model was regularly fed with new data samples. Real-time predictions was achieved by the model using the 20% data sets. The patients' personal physicians and caregivers received alert signals that were prompted by the model's prediction.
3.4. Systems Testing
The system was first tested by measuring HR, Sp02, and BT. These were noted alongside the data obtained using conventional instruments. The two value sets were contrasted with one another. Fifty participants participated in this test, which was conducted in the same way while adhering to ethical standards at all times. Thingspeak.com was used to successfully illustrate cloud data aggregation. Data was then transferred to a push notification API for instant alerting and monitoring.
4. RESULTS AND DISCUSSION
Plotting measurements from the standard devices versus those from the test device was done using the recorded data to construct the charts shown in Figure 3, which illustrates the comparisons of the standard values of HR and those measured from the HRPM in a linear regression graph. The outcome of the regression reveals that the R-squred value yielded 0.9842 (98%).

Figure 3. Standard HR against Measured HR
In Figure 4, the standard readings of the SpO2 were compared against those of the RHPM. The result showed that the r-squared value of the analysis yielded 0.967 (97%).
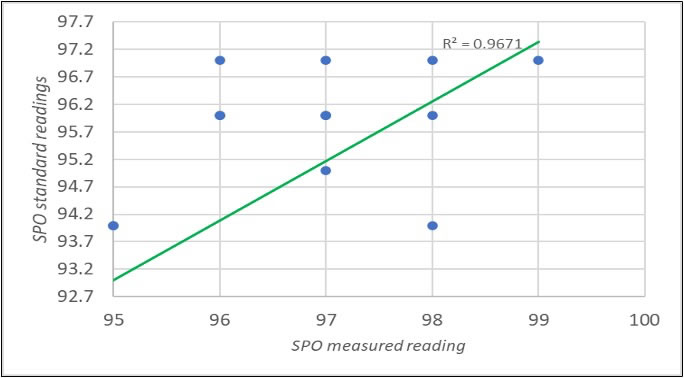
Figure 4. Plot of SpO2 Standard Reading against RHPM
Also, in Figure 5, is a linear regression graph of the readings of the standard BT against BT readings of the HRPM. The graph has the standard readings on the vertical axis while the measured readings were plotted on the horizontal axis. The graph also showed that the r-squared value of that analysis yielded 0.9691 (97%).
Table 2. Results of MAPE Calculations of the Test Parameters
Measured Parameter |
MAPE Value |
R-square Value |
BT |
2.32% |
0.98 (98%) |
Blood Oxygen SpO2 |
2.94% |
0.97 (97%) |
HR |
3.43% |
0.97 (97%) |
Equation (5) was used to get the Mean Absolute Percentage Error (MAPE) for each parameter. The MAPE results are shown in detail in Table 2, which presents the measurement accuracy between the tested device and standard measuring equipment within the framework of measured parameters.


Figure 5. The Plot of Standard BT against RHPM BT Readings
The results of the SVM prediction model are shown in Tables 3 and Table 4. Table 3 is a presentation of the result of the performance metrices, including cross validation result being 95%, training accuracy being 97%, and testing accuracy being 95%.
Table 3. Performance Result of the SVM Model
Performance Metrics |
Result |
Cross Validation |
95% |
Training Accuracy |
97% |
Testing Accuracy |
95% |
The result of the confusion matrix I presented in Table 4. The result indicates that during the classification by the model, there was zero case of false positive, and only 6 cases false negative. In all, 61% classification were correctly predicted as true negative and 57% recorded as true positive.
Table 4. Confusion Matrix
|
Unhealthy |
Healthy |
Unhealthy |
61 |
6 |
Healthy |
0 |
57 |
4.1. Discussion
From the IoT device performance tests, R-squared values for BT, SpO2, and HR were exceptionally high at 98%, 97%, and 97%, respectively. This further indicates that the measurements are in good correlation with the standards and hence show very strong accuracy and reliability. The MAPE values of the corresponding parameters measured by the test were 2.32%, 2.94%, and 3.43%, respectively. This shows a low deviation from the standard measures, hence proving the performance of the RHPM.
The forecasted health parameters were then classified using an SVM model, which gave an accuracy of 94.7% in cross-validation, 97% in training accuracy, and 95% in testing accuracy. The result indicated that the performance of the SVM on this test was very effective when generalizing to unknown data. In Addition, both classes achieved an F1-score of 0.95 and a perfect recall of 1.00, indicating that the model was able to identify all positive cases correctly. As seen in Table 4, the confusion matrix contains only six that are classified wrongly, showing that the model is effective in maintaining high classification accuracy and reliability.
5. CONCLUSION
The cloud-centric RHPM system, as proposed in this work, has been designed to monitor user health status continuously and in real-time. It captures physiological parameters with IoT technology and wearable fabrics, using edge-to-cloud technologies for streaming data analytical purposes. The system facilitates the transmission of users' bodily characteristics across cloud application interfaces to deliver personalized healthcare services through the usage of the MQTT protocol and facilitates remote access for stakeholders, including physicians and caretakers. The system testing results showed significantly high R-squared values of 0.98, 0.97, and 0.97, respectively, coupled with minimal MAPE values of 2.32% for BT, 2.94% for SpO2, and 3.43% for HR. The SVM model used to predict health status has a cross-validation accuracy of 94.7%. These demonstrate that the integration of technologies used in the system's development can result in a better alternative healthcare solution to personalized medicine since the RHPM's performance is extremely near to that of standard measuring instruments. However, we consider that the system may have limitations due to its reliance on an internet connection and the requirement for continuous calibrating streaming data. In future research, techniques for adaptive machine learning and idea drift management can be used to handle the ongoing calibration issue, even if internet connectivity may be a regional issue.
DATA AVAILABILITY STATEMENT
The data presented in this study are available on request from the corresponding author.
CONFLICTS OF INTEREST
The authors declare that they have no conflicts of interest in this work.
REFERENCES
[1] C. Obasi, I. Ndu, and O. Iloanusi, “A Framework for Internet of Things-Based Body Mass Index Estimation and Obesity Prediction,” in 2020 International Conference on e-Health and Bioengineering (EHB), IEEE, Oct. 2020, pp. 1–4. doi: 10.1109/EHB50910.2020.9280202.
[2] Adnene Arbi and Mohammad Israr, “Empowering Cyber-Physical Systems through AI-driven Fusion for Enhanced Health Assessment,” Int. J. Data Informatics Intell. Comput., vol. 3, no. 3, pp. 16–23, Aug. 2024, doi: 10.59461/ijdiic.v3i3.127.
[3] J. X. and L. Xu, “Sensor System and Health Monitoring,” Integr. Syst. Heal. Manag., 2017.
[4] L. M. S. do Nascimento, L. V. Bonfati, M. L. B. Freitas, J. J. A. Mendes Junior, H. V. Siqueira, and S. L. Stevan, “Sensors and Systems for Physical Rehabilitation and Health Monitoring—A Review,” Sensors, vol. 20, no. 15, p. 4063, Jul. 2020, doi: 10.3390/s20154063.
[5] WHO, “Health Monitoring Service,” World Heal. Organ., 2023, [Online]. Available: https://www.who.int/teams/integrated-health-services/monitoring-health-services
[6] T. Malche et al., “Artificial Intelligence of Things- (AIoT-) Based Patient Activity Tracking System for Remote Patient Monitoring,” J. Healthc. Eng., vol. 2022, pp. 1–15, Mar. 2022, doi: 10.1155/2022/8732213.
[7] Atta Ur Rahman, Bibi Saqia, Yousef S. Alsenani, and Inam Ullah, “Data Quality, Bias, and Strategic Challenges in Reinforcement Learning for Healthcare: A Survey,” Int. J. Data Informatics Intell. Comput., vol. 3, no. 3, pp. 24–42, Sep. 2024, doi: 10.59461/ijdiic.v3i3.128.
[8] O. Hochberg and I. Berger, “Bedside EEG Monitoring in the Neonatal Intensive Care Unit,” Curr. Treat. Options Pediatr., vol. 8, no. 3, pp. 295–307, May 2022, doi: 10.1007/s40746-022-00248-9.
[9] N. Y. Philip, J. J. P. C. Rodrigues, H. Wang, S. J. Fong, and J. Chen, “Internet of Things for In-Home Health Monitoring Systems: Current Advances, Challenges and Future Directions,” IEEE J. Sel. Areas Commun., vol. 39, no. 2, pp. 300–310, Feb. 2021, doi: 10.1109/JSAC.2020.3042421.
[10] M. Dadkhah, M. Mehraeen, F. Rahimnia, and K. Kimiafar, “Use of Internet of Things for Chronic Disease Management,” J. Med. Signals Sensors, vol. 11, no. 2, pp. 138–157, Apr. 2021, doi: 10.4103/jmss.JMSS_13_20.
[11] S. Majumder, T. Mondal, and M. Deen, “Wearable Sensors for Remote Health Monitoring,” Sensors, vol. 17, no. 1, p. 130, Jan. 2017, doi: 10.3390/s17010130.
[12] A. Ray and H. Ray, “Wearable Sensors based Smart Secured Remote Health Monitoring System,” in 2021 International Conference on Advances in Electrical, Computing, Communication and Sustainable Technologies (ICAECT), IEEE, Feb. 2021, pp. 1–6. doi: 10.1109/ICAECT49130.2021.9392533.
[13] A. Gutte and R. Vadali, “IoT Based Health Monitoring System Using Raspberry Pi,” in 2018 Fourth International Conference on Computing Communication Control and Automation (ICCUBEA), IEEE, Aug. 2018, pp. 1–5. doi: 10.1109/ICCUBEA.2018.8697681.
[14] A. Kaur and A. Jasuja, “Health monitoring based on IoT using Raspberry PI,” in 2017 International Conference on Computing, Communication and Automation (ICCCA), IEEE, May 2017, pp. 1335–1340. doi: 10.1109/CCAA.2017.8230004.
[15] S. K, S. K, Y. M. G, and T. P, “Smart Health Monitoring System for Coma Patients using IoT,” in 2023 7th International Conference on Computing Methodologies and Communication (ICCMC), IEEE, Feb. 2023, pp. 1342–1347. doi: 10.1109/ICCMC56507.2023.10084196.
[16] H. L. Yimer, H. D. Degefa, M. Cristani, and F. Cunico, “IoT-Based Coma Patient Monitoring System,” Nov. 2024, [Online]. Available: http://arxiv.org/abs/2411.13345
[17] R. Subha, M. Haritha, B. Nithishna, and S. G. Monisha, “Coma Patient Health Monitoring System Using IOT,” in 2020 6th International Conference on Advanced Computing and Communication Systems (ICACCS), IEEE, Mar. 2020, pp. 1454–1457. doi: 10.1109/ICACCS48705.2020.9074174.
[18] Ramesh Saha, S. Biswas, S. Sarmah, S. Karmakar, and P. Das, “A Working Prototype Using DS18B20 Temperature Sensor and Arduino for Health Monitoring,” SN Comput. Sci., vol. 2, no. 1, p. 33, Feb. 2021, doi: 10.1007/s42979-020-00434-2.
[19] S. Ramadurgam and D. G. Perera, “An Efficient FPGA-Based Hardware Accelerator for Convex Optimization-Based SVM Classifier for Machine Learning on Embedded Platforms,” Electronics, vol. 10, no. 11, p. 1323, May 2021, doi: 10.3390/electronics10111323.
[20] B. A. Ikharo and D. Aliu, “Challenges Associated with Wearable Internet-of-Things (IoTs) Monitoring Systems for E-Health,” FUOYE J. Eng. Technol., vol. 8, no. 4, Dec. 2023, doi: 10.46792/fuoyejet.v8i4.1099.
BIOGRAPHIES OF AUTHORS

Chukwuemeka Obasi held a PhD in digital electronics and computer engineering from the University of Nigeria in Nsukka, Nigeria in 2023, a master of engineering (M. Eng) degree in Computer and Control engineering from the Nnamdi Azikiwe University in Awka, Nigeria in 2016, and a bachelors of engineering degree (B. Eng) in Computer engineering from the Enugu State University of Science and Technology, Enugu, Nigeria. He is currently a senior lecturer at the Department of Computer Engineering, Edo University Iyamho, Edo State, Nigeria. His current research interests include robotics, cloud computing, biosensors, embedded systems, machine learning, human-centric computing, Intelligent systems, and the Internet of Things (IoT). He can be contacted at: chukwuemeka.obasi@edouniversity.edu.ng

Braimoh Ikharo graduated from Abubakar Tafawa Balewa University in Bauchi with a B.Eng. in Electrical/Electronics Engineering, an M.Eng. in Electronics Engineering, and a Ph.D. in Communications Engineering. He is a lecturer at Edo University Iyamho's Department of Computer Engineering. Big Data Analytics and the Internet of Things, Computer Networks and Data Communication, Mobile Cellular and Wireless Communication, and Modeling Tropospheric Effects on Radio Wave Propagation for Communications are some of his areas of interest. He can be contacted at: ikharo.braimo@edouniversity.edu.ng