Knowledge Discovery for Patient Survival in a Clinical Discharge Dataset Using Causal Graph Ontological Framework
Omachi Okolo1, B.Y Baha1, M.D Philemon1
1Department of Information Technology, Modibbo Adama University, Yola, Nigeria
Corresponding Author:Omachi Okolo (e-mail: omachi.okolo@gmail.com)
DOI: https://doi.org/10.59461/ijdiic.v4i1.162
Article history: Received December 17, 2024, Revised February 15, 2025, Accepted February 24, 2025
ABSTRACT
Knowledge mining from clinical datasets is a critical task in healthcare as well as other fields. While the existing methods, such as randomized controlled trials (RCT) and other automatic machine extraction, have been helpful, they have become increasingly insufficient to keep pace with time, and robust models are required for clinical decisions. In this paper, we present a new method to address this challenge by using the Causal graph ontological model. Our study used a semi-structured textual clinical discharge dataset from the Statewide Planning and Research Cooperative System (SPARCS) to design and validate the patient survival rate assumptions from the dataset. We extracted the clinical information and organized it according to medically relevant fields for decision-making (Diseases, confounders, treatment, and the survival rate). The initial assumptions model was validated using the conditional independent test (CIT) criteria. The outputs of the LocalTest validation showed that the conceptual assumptions of the causal graph hold since the Pearson correlation coefficient ranges between -1 and 1, the p-value was (>0.05), and the confidence intervals of 95% and 25% were satisfied. Furthermore, we used Shapley values to perform sensitivity analysis on the features. Our analysis showed that two variables, such as gender and diseases, contributed little to the survival rate prediction. Our study concludes that the combination of causal graph ontological framework and sensitivity analysis to discover knowledge from the clinical text could help improve the quality of clinical decisions in the text, remove bias in the assumption in medical applications, and serve as a premise for modelling causal data for natural Language machine learning predictions.
This is an open access article under the CC BY-SA license.

Keywords: Clinical text Analysis, Causality, Causal assumption, Causal graph, Causal graph validation
1. INTRODUCTION
Knowledge discovery from textual data using causality is a new basis for reasoning and decision-making in natural language-based artificial intelligence systems. This is because causal graphs can be exploited to contribute to advancements in statistical methods, natural language processing (NLP), and machine learning to extract meaningful relationships from unstructured medical data [1]. The recent availability of electronic health records (EHR) has made this area of research a burgeoning domain. The volume of clinical information presents both challenges and opportunities for medical researchers, data scientists, and clinical decision-makers who seek to extract valuable insights and generate new knowledge from the vast amount of available clinical data [2]. Traditional methods such as randomized controlled trials (RCT) and other knowledge discovery methods to decipher causal knowledge from data have become problematic for reasons such as cost, ethics, and the ability to keep pace with the urgency required for clinical decisions [3]. As a result, it becomes pressing to devise new methods and technologies that can efficiently utilize observational data to process, analyze, validate, and synthesize knowledge from textual sources [4].
In recent times, one of the cutting-edge methods to address information extraction (IE) from observational clinical data is the Causal graphs (CGs). The field of causality in clinical care deals with how to map cause and effect relations from data, which can be a relationship between two or more entities in a numerical or textual format [5]. In clinical terms, such a method seeks to establish whether a patient suffering from a disease survives based on relationships between treatment, the confounders (age, severity of the disease, sex), and the outcome, etc. However, despite the progress made in the use of causal models to extract causal relations from observational datasets, the causal assumptions from these models are not validated for correctness before using them for medical decisions. A study by [6] surveyed causal model applications in healthcare and revealed that the model's assumptions were not tested or validated. Thus, doubts are cast on the model assumptions and the eventual discovery of knowledge from the process. Therefore, in this study, we have modelled a novel causal graph based on the domain knowledge from a semi-structured clinical discharge dataset to establish the survival of patients in the textual dataset. We employed a causal graph to map causal relations by extracting causal variables from a semi-structured textual clinical dataset converted to a causal graph, which can be useful to medical practitioners in quickly establishing cause and effect relationships, such as treatments-mediates-survival, confounders-cause-complications, treatments-improve-survival, and by extension help the caregivers to customize treatment, improve conditions or curate survival plans for the patients. We used the conditional independence test (CIT) criteria and Shapley values sensitivity analysis for testing the causal assumptions of the textual dataset to determine the correctness of our assumptions from the textual dataset.
Building such causal relations using causal graphs from medical texts can be of great importance to medical science. According to [7], the importance of causal knowledge discovery in the medical diagnostic process includes improving the accuracy of diagnosis, helping to explain the causal relations in diagnosis and selecting intervention strategies for a particular disease. Given the critical importance of knowledge discovery (KD) from causal relations in clinical decision-making, there is traction in research aimed at incorporating medical causal knowledge into clinical decision support systems by adopting related tools such as causal discovery ontology and inference [7][8].
The specific contributions of this paper are:
- Perform knowledge discovery (KD) from textual clinical dataset
- Converts clinical text into causal knowledge using a causal graph.
- Validate the causal graph assumptions
- Propose an algorithm for extraction and validation of causal clinical text causvalidationes.
- Propose a Causal Graph Ontological framework for explainable clinical text.
The rest of this study is structured as follows: we reviewed related studies, the basic concept of the causal model, and assumptions driving the causal graphs in section 2. In section 3, we discussed the methodology. Section 4 presents the causal graph knowledge discovery process, the results of the causal graph validation, and the discussion of the results. Section 5 concludes the study and gives direction for future work.
2. LITERATURE REVIEW
Causal variables extraction and relation is the central concern of causal machine learning made possible by recent artificial intelligence in medical data [6]. Recently, there has been research traction in causality; however, it remains an evolving field, especially in textual tasks, because of the difficulty of extracting causal variables from text [9]. Survey research by [6] revealed that studies in causality extraction (CE), have received attention in areas such as medical care, social science, media, biomedicine, emergency management, etc. This shows the wide application of causality and causal graphs in knowledge discovery. A study by [10], revealed that causal graphs can extract causal variables expressed in clinical text with clarity on cause-effect relationships. Their study proposed a method that can extract causal variables from clinical notes and convert them into causal graphs, which can effectively establish the relationships described in the text. Similarly, [11] highlights the importance of identifying confounding variables through causal graphs, noting that while the existing methods of text analysis yield huge graphs, they are not tailor-made for precision. A study by [11] established the need to curate a clinical dataset that can be used for precision decision-making in a particular demography. Moreover, the use of causal graphs to model electronic health records (EMRs) continues to present both opportunities and challenges. Research by [12] revealed the potential of knowledge graph technology in the medical field, particularly in constructing causal inference and discovery from large datasets. They suggest that the continuous growth of EMRs provides a rich source of data for causal discovery and machine-learning applications that can enhance the quality of causal decision-making. The application of advanced machine learning techniques, such as graph neural networks, has also been explored in this context. For instance, [13] proposes the extraction of causal variables through the use of a graph neural network to enhance causal event extraction by incorporating prior knowledge from causal networks. This approach underscores the importance of contextual understanding in capturing causal relationships from text based on cause and effect rather than spurious correlations in traditional machine learning predictions. Furthermore, [14] illustrates how large electronic medical records can be converted into causal health knowledge graphs for medical decision-making.
Despite the advancement in causal inference and discovery research to extract knowledge from clinical data, there is still a challenge in ensuring that the extracted entities align with the logical structure of the medical texts, as highlighted by [15], who noted that developing personalized causal graph from clinical data should be made to realign with causal assumptions in a dataset and should also be validated. Moreover, a study by [6] revealed that one of the issues in constructing causal graphs from clinical texts is how to extract and validate causal assumptions from the unstructured dataset.
To address these issues, our study reviewed closely related studies that attempt to fill these gaps, and it also covered knowledge discovery in clinical discharge text.
Table 1. Summaries of related studies of causal discovery using causal graph
References |
Research Focus |
Method |
Gap identified |
[3] |
Design and validation of a Causal Model that focused on educational datasets. |
The study designed and validated a causal graph from an educational dataset in the Northeast Nigeria (SENSE - EGRA) project. |
The study focused on the educational dataset but validated the causal graph with the Conditional Independence Test (CIT). |
[8] |
The use of Directed acyclic graphs in clinical risk prediction modelling. |
Incorporating causal knowledge into clinical risk prediction model using the Markov principle. |
The study used the Logistic regression model as an evaluation metric |
[23] |
Causality-based feature selection: Methods and evaluations. |
Causal-based variable selection using a synthetic and real-world dataset |
The study used the CausalFS algorithm for causal discovery |
[24] |
Integrating causal model ontologies with LIME for machine learning explanations in educational admissions. |
The use of causal structure and LIME to extract admission criteria from an admission database |
Gaussian Naïve Bayes, Decision Trees, and Logistic Regression. |
[25] |
Use of Shapley values for data valuation in medical imaging application |
Use of Shapley values for data valuation and bias in dataset |
Identifying bias in data valuation |
From the review listed in Table 1, similar studies have been conducted in the areas of causal discovery using causal graphs. The study by [8][23][24] discussed the value of causal discovery using causal DAG. However, the results of their studies were evaluated using logistic regression, causal and Gaussian Naïve Bayes, Decision trees and logistic regression, respectively. Our study was closely related to [3], which designed and validated a novel causal model in an educational dataset provided by research to strengthen early education programs in Northeast Nigeria. Our study builds on these studies [3][8][23][24][25] by designing and validating the causal graph assumption with a conditional independence test (CIT). The novelty of our study is demonstrated with the combination of conditional independence test (CIT) and Shapley values to estimate the sensitivity analysis of the input variables on the output of the patient survival in a clinical discharge text.
2.1. Causal Graph Design and Validation
A causal graph can show a higher form of understanding of observational data by describing the causal relationships learned about the data. It is denoted as 𝐺= (𝑉, E), which consists of two or more nodes or vertices representing a set of a random variable (𝑉), 𝑤ℎ𝑒𝑟𝑒 𝑉=𝑋1, 𝑋2…𝑋𝑛 and the connecting edges called (𝐸). Studies by [16] pointed out three levels of causal hierarchy, as revealed by Pearl: the association level, intervention level, and counterfactual level.
From the causal hierarchy coined by [16] as shown in Table 2, our study resides at the level of observation in an observational clinical dataset. More so, a directed Acyclic Graph, which takes the form of a fork, collider, and chain/mediator, is the dominant form of causal graph model and works with most causal algorithms, while a few work with the cyclic graph condition [3]. The causal assumption supported in DAG is that of acyclicity, which means that the flow of information in the causal structure is not cyclical [4]. DAG provides an approach to encode conceptual assumptions graphically by depicting the hypothesized causal relationships in an observational dataset. It also provides a mathematical model that can be analyzed [17]. More so, a causal diagram can help us understand whether and how to identify a causal effect in observational data and test if the assumptions encoded in the DAG were supported.
Table 2. Pear level of causal hierarchy culled [16]
Leve |
Action |
Query |
Example |
Associational learning |
Observing |
How does observing |
Does caffeine generally tend to cause insomnia than carbon monoxide? |
Interventional learning |
Conditioning |
How does intervening on X = x affect Y given Z = z? |
Is there a causal effect of caffeine intake on insomnia? |
Counterfactual learning |
Imagining |
What would have been Y under X = x, given that we have |
Would a patient suffer insomnia if he/she takes caffeinated drinks, given that the patient does not suffer from insomnia and has never taken insomnia? |
The crucial epoch in causal graph formulation is to achieve independence or d-separation among the variables in the graph and to achieve causal effect in observational data. This implies that two nodes, X and Y, are conditionally independent given a set of node(s) Z when Z blocks all open paths that connect X and Y. Basically, the concept of d-separation in causal graph is to control the information flow in a graph with a view for each variable to achieve independence. In other words, (in) dependence in the graph is a function of open or closed paths between nodes in this graph. It is expressed that two nodes in a causal graph or the directed acyclic graph (DAG) G are d -d-separated when all paths between them are blocked. There are three types of d-separation processes in causal graphs: backdoor adjustment, front door adjustment, and instrumental variable. Each is used depending on the graph structure. The DAG structure constructed from observational data is expected to have satisfied the causal assumptions such as the Acyclicity assumption, The Markov assumption, and the causal sufficiency assumption [4], etc.
3. METHODOLOGY
This study adopted a quantitative research design that bears relevance to statistical knowledge discovery and causal model building that serves as a background for machine learning systems in similar studies such as [3][9]. The quantitative method that brings about knowledge discovery using the causal graph model is a positivist research paradigm [17]. This method helped to address the knowledge discovery process involved in converting clinical text in semi-structured medical records into causal knowledge graphs.
3.1. Dataset
This study used a secondary dataset obtained from one of the major publicly available clinical datasets. This dataset consists of the de-identified Inpatient discharge notes collected together from the Statewide Planning and Research Cooperative System (SPARCS) in the United States. The details of the dataset include patient characteristics, diagnoses, treatments, services, and charges. This dataset consists of basic record-level details for the patient discharges. Since the dataset is de-identified, the health information is not individually identifiable, and it does not contain records that are protected by health information (PHI). The open nature of the dataset available at healthdata.gov allows clinical studies to be reproduced and improved in ways that would otherwise be difficult. The dataset contains about 757123 distinct hospital admissions for both adults and children and cuts across different races and ethnic divisions. For this study, we extracted 15000 samples from the dataset for the causal modelling experiment. The choice of sample size was predicated by [21][22] that insufficient sample size is not a uniquely causal problem since it may lead to statistical and algorithmic bias. For the details of the dataset, check the data availability section.
3.2. Proposed Research Process Model
This study proposes a causal graph model for knowledge discovery anvalidationon from clinical text datasets. The process of achieving the causal discovery goes through some sequence of steps, which are preprocessing, knowledge encoding and converting clinical text into causal knowledge, validating the causal graph, and providing explanations.
Figure 1 below shows the iterative process for the knowledge discovery (KD) in the Clinical dataset:
- Preprocessing the datasets through data cleaning, outlier detection, and removal.
- Extract part of the Clinical dataset that is relevant for the task of patient survival mining and process it for the Causal Graph framework through the process of coding and using the ablation technique to dispose of clinically irrelevant text or information that is also causally irrelevant [18].
- Design a structural Causal graph model Ontology framework from the Clinical discharge dataset.
- Validate the Assumptions encoded in the structural causal graph Ontology framework from the Clinical discharge test dataset using the Conditional Independence Test (CIT) criteria.
- Test if the causal assumption is established.
- Design of the algorithm for the CIT validation process.

Figure 1. The process flow chart of the knowledge discovery of clinical text
3.3. Implementation tools
The Causal Graph Ontological framework is implemented using three tools, which are:
- Google Colab notebook: This was used for dataset preprocessing and feature engineering to understand the clinical dataset.
- Digitty package: This package was used to design the causal graph ontological framework and the initial causal graph assumptions among the variable Set in the dataset.
- R programming: This was used as a coding platform for the causal graph assumptions design anvalidationon using the Conditional Independence Test (CIT) criteria. The causal graph model assumption and the criteria from the Dagitty package were imported into R alongside the dataset for design anvalidationon.
3.4. Algorithm for the Computation of Causal Graph Model Validation for Clinical Text using CIT
The step-by-step process of validating the causal graph model of clinical text using the conditional independence test (CIT) criteria is shown below. This is essential to show the algorithmic process of how the causal graph framework was validated. The algorithmic procedure is important because of the paucity of literature on medical causal graph design anvalidationon [6].

3.5. Additional Metric of Sensitivity Analysis for Variable Validation
Shapley value was adopted to identify the impact of each covariate on the accuracy of the model prediction.

The Shapley value presented in Equation (1) was used to model a given set of clinical discharge set C and a metric for performance P, such as test accuracy. The Shapley value for the different variables C was represented. In our experiment, P(S) is denoted as the survival rate prediction accuracy on the test set held out in the partition. Intuitively, the Shapley value visualization plot functions such as summary and waterfall were used to estimate the sensitivity of feature contribution to the target variable in the dataset.
4. IMPLEMENTATION OF THE CAUSAL GRAPH MODEL AND VALIDATION
The steps for the causal variables coding and extraction, knowledge discovery, causal graph design, anvalidationon are shown below in the next subsections.
4.1. Dataset Groupings into Medical Classes for Knowledge Discovery
The dataset originally contained thirty-three columns and was grouped into seven related subsections for easy identification, knowledge discovery, and modelling. These are (i) Hospital Information - (ii) Patient Demography, (iii) Diagnosis, (iv) Treatment, (v) Notes/Reports, (vi) Billing Method, and (vii) Cost. The details of the dataset's grouping can be seen in Table 3 below.
Table 3. Dataset class groupings
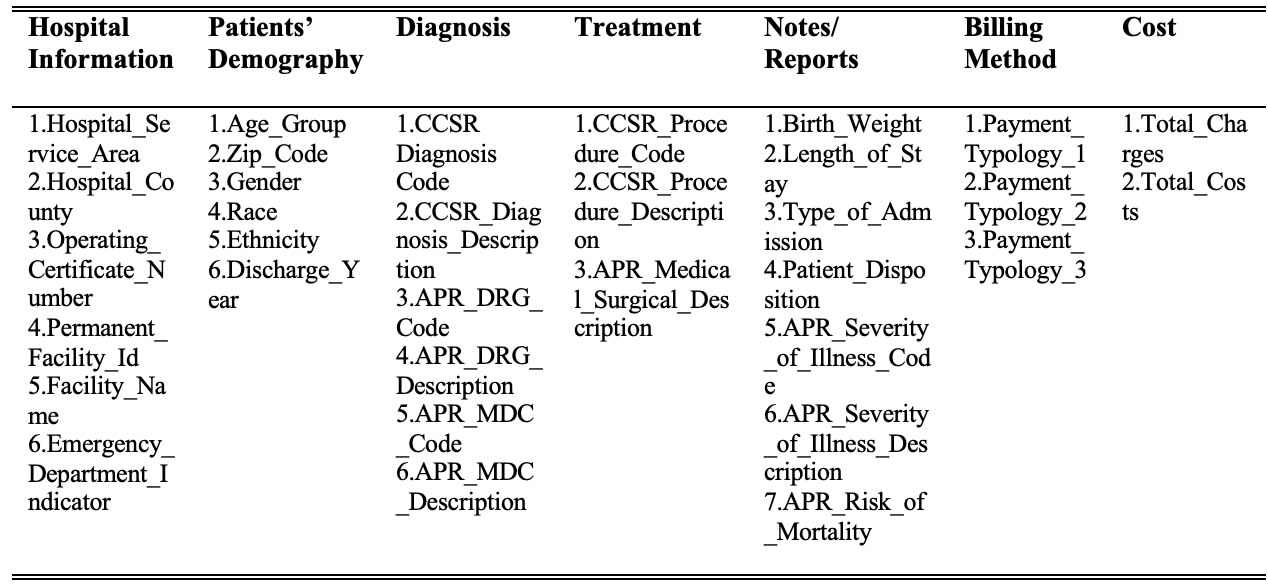
The dataset grouping in Table 3 coalesces the thirty-three columns into seven related classes for easy identification and knowledge discovery. Each of the classes described in Table 2 has been graphically depicted to show their grouping and relationship in the dataset.
Figure 2 reveals the data grouping and the number of variables grouped into each class. It also shows that the hospital information has no strong relationship with other classes as it relates to modelling the data. Therefore, the relationship with other classes was dotted to represent that weak relationship.
The initial clinical dataset contained 33 variables, which were both numeric and textual datasets. This stage involves preprocessing by cleaning and dropping variables or removing records that are not relevant for modelling the Clinical dataset to uncover the causal target variables in the dataset, which is modelling survival_rate in the dataset. This was done through the ablation technique and clinical language modelling, which helps to dispose of clinically irrelevant text or information that is also causally irrelevant to the target class [18].
4.2. Knowledge Discovery through coding, feature engineering for Causal Variables Selection
The main thrust in causal text extraction is the analyses of text data through coding [20], which is a way of reducing the document or dataset into a simpler set of labels, or variables that realign with the causal interest. The causal Graph Model (CGM) implemented using Directed Acyclic Graph (DAG) in this study presents an attempt to encode the concepts of interest in causal graphs. It is, therefore, context-specific. In causal machine learning, directed acyclic graphs (DAGs) are presented here as an intuitive diagram of cause-effect relationships in the clinical discharge dataset. Therefore, the CGM ontological framework is designed based on the domain knowledge of the clinical discharge dataset used in this study.
To model the Survival_rate in the clinical dataset, the target classes and the variables needed for the causal graph modelling were first identified through the process of data exploration and feature engineering to generate new knowledge from the dataset. Thus, with the aid of the domain knowledge of the clinical dataset through data exploration and feature engineering, the variables labelled Patient_Disposition in the notes/report category were found to be valuable in generating another important variable called Survival_rate. In the context of the explanation of clinical text column names, Patien_Disposition defines a place where a patient retires after being discharged from the hospital, as shown in Figure 3.

Figure 2. Data flow of the entire clinical text dataset, with classes, variables, and their Relations

Figure 3. Patient Disposition Class Values
From Figure 4, it was discovered that the Expired label shows the number of patients who died after hospital admission. This column was important for identifying and modelling the number of patients who survived or died after being admitted to a particular hospital and administered some treatment.
The process of knowledge discovery produced the target class called the Survival_rate variable from the Patient_Disposition variable. Thus, after identifying the target variable, the study proceeded to identify the causal variables that could help model the causal relationship for the survival rate label. Therefore, the variables that are not needed since they will not provide significant insight into the model target were removed. Those classes of data, such as Hospital_Information, Billing Method, and Cost, were ablated. This was done in consultations with clinicians and medical domain specialists. The reason why the ablation technique and expert knowledge were needed was to remove some columns that could introduce bias into the model [3][8].

Figure 4. Feature engineering on the Pateint_Disposition column
Furthermore, the variables needed for further modelling the dataset were narrowed down to seven (7). The knowledge discovered from the clinical text was encoded to make an informed decision on the number of people that died or survived in the dataset. Therefore, the final variables selected for the model are shown in Table 4.
Table 4. The final variable selected and its descriptions
S/No |
Variable |
Description |
1. |
Age_Group (AG) |
The age distribution of the patients |
2. |
Gender |
Sexual identities of patients |
3. |
APR_MDC_Description |
All patients refined of Major Diagnostic Categories (MDC) description |
4. |
APR_Severity_of_Illness_Description |
All patients refined (APR) the severity of the illness. It groups the severity of illness into four. |
5. |
CCSR_Procedure_Description |
Clinical Classifications Software Refined (CCSR) procedure description based on international classification of Diseases (ICD) |
6. |
APR_Risk_of_Mortality |
This groups the disease mortality level into four groups. |
7 |
Patient_Disposition or Survival_rate |
A place or setting to which a patient was discharged to stay on the day of discharge. |
The seven variables causally selected to model the survival_rate from the textual clinical dataset were aggregated and represented show graphically to depict the knowledge discovered from the clinical text dataset for the causal graph modeling. These were depicted graphically using ontological representation as shown in Figure 5.
Ontology is a theory of logic that seeks to explicitly and specifically represent an idea or a process using a framework. Ontological data mining or knowledge discovery applied in this study can help identify and understand the specific causal variables needed for the prediction of the survival rate in a clinical text dataset [19]. The ontological representations in Figure 5 revealed each variable has a scaffolding level of variables representational of knowledge that uncovers the nature of variables perspective, interaction, and insights that can inform us on the survival rate in the dataset used in this study [19].
4.2.1. Numeration of the Categorical Variables
After acquiring the needed variables to model the survival rate of patients admitted to the hospitals, the textual variables shown graphically in Figure 5 below were then converted to numeric values, as shown in Table 5, through the process of label encoding. This process of converting the textual variables to numeric values is important for validating the Causal Graph ontological framework designed from the dataset using the conditional independence test (CIT) criteria.
4.3. Causal Graph Model Assumption Design and Formulation Using Discovered Knowledge
The Causal Graph represented in the Directed Acyclic Graph (DAG) Ontological framework was first designed in dagitty applications. The framework can help explain and predict the variable of interest in the research which is the Survival rate of patients admitted in the hospitals. Thus, the Causal graph DAG ontological framework for the survival rate of patients in the clinical discharge dataset as shown in Figure 6 shows the causal relations or interaction between variables such as diseases, treatment, confounders, and survival rate.

Figure 5. A data-flow ontological framework of the clinical text dataset survival rate with variables and their relations
Table 5. The converted clinical dataset for CIT validation
Diseases |
Gender |
Age_group |
Severity |
Mortality |
Treatment |
Survival_rate |
13 |
1 |
4 |
1 |
0 |
133 |
1 |
12 |
0 |
3 |
3 |
2 |
237 |
1 |
24 |
0 |
1 |
2 |
2 |
44 |
1 |
9 |
1 |
4 |
1 |
1 |
8 |
1 |
12 |
0 |
3 |
3 |
2 |
146 |
1 |
19 |
1 |
3 |
1 |
3 |
59 |
1 |
12 |
0 |
3 |
2 |
2 |
237 |
1 |
23 |
1 |
0 |
3 |
2 |
262 |
1 |
18 |
1 |
3 |
3 |
3 |
139 |
1 |
4 |
0 |
4 |
1 |
3 |
8 |
1 |
13 |
0 |
3 |
1 |
1 |
8 |
1 |
2 |
1 |
1 |
1 |
2 |
237 |
1 |
From the causal graph in Figure 6, the first variable, Diseases in the graph ontological model, represents the patient diagnosis after being admitted to the hospital. The diseases equate to the APR_MDC_Description variable from the dataset, which is comprised of 25 different diseases according to the International Classification of Diseases (ICD); each patient has one or more of these diseases per hospital admission. The second variable, treatment, also known as CCSR_Procedure_Description, measures the different procedures or treatments carried out on a patient during hospital admission. There were about 320 different treatments recorded from the data exploration on the variable treatment. A sample of these were shown annotatively in Figure 5. From domain experts, it was also gathered that treatment mediates between Diseases and patient survival_rate in the clinical processes. The Survival_rate variable is a feature engineered from Patient_Disposition, which is a variable that shows the state of the patient after the hospital, as shown in Figure 4.

Figure 6. The Causal Graph Ontological Framework for the prediction of patients’ Survival rate in Clinical Discharge Dataset
Moreover, one important variable discovered in the Causal graph, as shown in Figure 6, is the confounders. The Confounders are variables such as {Age_Group, Gender, APR_Risk_of_Mortality, and APR_Severity_of_Illness_Description}. In causal analysis, Confounders are variables whose presence affects other variables in the causal assumptions so that the results do not reflect the actual direct relationship. These confounding variables identified from our causal discovery have the potency to affect the Diseases, Treatment, and, by extension, the survival rate of patients in the hospital, as shown in Figure 6.
Therefore, the causal arrowhead points from Diseases to the treatment and then to the survival rate. However, the confounder can induce or influence diseases and complicate treatment and the survival rate of the patients. In simple notation, The Causal Graph ontological framework depicts the non-parametric graphical representations of hypothesized causal relations between the variables represented in the nodes, such as Diseases, Treatment, survival rate, and the confounders. The causal graph ontological framework of Figure 6 shows the relationships among the variables in the clinical discharge dataset.
The Directed acyclic graph (DAG) for the assumed patient Surivival_rate causal structure shows that Diseases: the exposure, treatment received by the patient: treatment variable, Survival_rate is the outcome variable, Confounders is the observed confounding variable. The causal relationship between diseases, confounders, treatment, and survival rate is potentially nonlinear.
From the hypothesized design of the Causal graph ontological framework of the Clinical Discharge Dataset Survival rate in Figure 6, we encoded or formulated the reality from the clinical discharge dataset mapped into the causal model that implies the following conditional independences and assumptions:

Equation (2) interprets diseases as independent of survival_rate given or conditioned on confounders and treatment. Simply put, that a person is sick does not equal surviving or dying unless you consider other factors such as confounding variables and the treatment administered. Where, Confounders = {Age_Group, Gender, APR_Risk_of_Mortality, and APR_Severity_Description}.
The symbol “⊥” or "_||_", as shown in equation 3, stands for independent of, and “|” stands for, given or conditioned on.
However, from the Causal graph, there was a biasing path that was opened by the Confounders that requires minimal adjustment sets for controlling or conditioning the information flow in the graph and for estimating the total effect of Diseases on Survival_rate given other variables. Therefore, conditioning or d-separation is necessary for blocking paths between (sets of) nodes in a causal graph produced by confounders. Therefore, we conditioned on confounders by using a backdoor adjustment method operation to implement independence.
The d-separation method is sufficient to identify the estimand, also known as the mathematical formula for adjusting covariates and estimating the causal impact of the intervention by using the do-action formula, i.e. (y|(t)). We perform an intervention on the [Confounders- (y|(confounders))] as in Figure 8 above to block the backdoor paths. Therefore, the d-separation on the confounders to eliminate the confounding bias produced the following equations, assumptions, or mathematical formulas for testing the encoded model using the Conditional Independence Test (CIT). This implies:

4.4. Causal Graph Model Validation Result Interpretations
In this study, the identified causal assumptions of patient survival in equations (2) (3) (4) (5) (6), which were obtained from the causal graph ontological framework in Figure 8, were used alongside the dataset to perform the conditional independence test (CIT). The overarching objective of testing the causal diagram or knowledge discovered is to confirm or reject the CIT assumptions encoded and identified in the Causal graph ontological framework. The results of the causal graph assumptions obtained from equations were validated and shown in Table 6.
Table 6. Results of the CIT criteria for each instance of confounders using the equations
Confounders |
CIT Criteria |
LocalTest Estimate
|
Confidence Interval |
||
p-coefficient |
p.value |
2.5% |
97.5% |
||
Gender |
Dsss _||_ Srv_ | Gndr, Trtm |
0.005141721 |
0.5289365 |
-0.02114432 |
0.01086351 |
Age_Group |
Dsss _||_ Srv_ | Ag_G, Trtm |
-0.08660599 |
0.08177213 |
-0.1024691 |
-0.07069977 |
Severity |
Dsss _||_ Srv_ | S_I, Trtm |
-0.01353112 |
0.09751101 |
-0.02952907 |
0.002473756 |
Mortality |
Dsss _||_ Srv_ | R_M, Trtm |
-0.002604563 |
0.7497719 |
-0.01860813 |
0.01340034 |
The results of thvalidationon of the causal graph ontological framework revealed that the Pearson correlation coefficient estimates are within the range of 1 to -1 and close to the zero mark, with a very narrow confidence interval (CI) measured at 25% and 95%. Secondly, the p-values are above the 0.05 (>0.05) threshold as indicated in the evaluation metrics in Table 7.
Table 7. CIT Criteria Metrics
Metrics |
Lower bound |
Upper bound |
Pearson correlation coefficient estimates |
-1 |
1 |
p-value |
>0.05 |
1 |
Confidence interval (CI) |
25% |
97% |
These results validate the assumption proposed in equations (2) (3) (4) (5) (6) coined from the causal diagram in Figures 5 and 6. This shows that the conceptual model of the clinical discharge dataset for patient survival holds as reflected in the Causal graph ontological framework in this study. Otherwise, there will be a need to redesign the causal relationships from the dataset again, as indicated in the iterative structure in algorithm 1 in section 3.4.
4.5. Sensitivity analysis using Shapley Values
Sensitivity analysis was implemented with XGBOOST to predict the survival rate of patients in the clinical discharge text. The prediction was made on the unseen partition of the dataset; the initial predictive accuracy using XGBOOST was 93.90%. Moreover, we estimated the impact of the variables on the survival rate prediction from the clinical discharge text using shapely values on the 100th observation from the dataset. The impact of the variables is shown in Figure 7.

Figure 7. Variation of the feature impact on patient survival rate
In addition, we used the waterfall function of the Shapley values to quantify the impact of the features on the prediction; the result is shown below in Figure 8.

Figure 8. The positive and negative impact of the features on the patient survival rate
4.6. Discussions
This study created a niche in causal graph model ontology to extract causal variables from clinical text and explain the representation in medical terms. Ontology is a theory of logic that seeks to annotate explicitly and specifically represent an idea or a process using a framework [19]. Ontological data mining or knowledge discovery conceptualized in this study can help identify and understand the specific causal variables needed for the prediction of the survival rate of patients in a clinical text dataset, as shown in Figures 4 and 6. This study harnessed the rich graphical and logical representational knowledge inherent in ontologies to uncover the nature of variables perspective, interaction, and insights that can inform the patient survival rate in the textual clinical dataset used in this study.
The variation of Causal graphs called directed acyclic graphs (DAGs), used in this study serve as a powerful tool for causal assumptions modelling, design validation on, and visualizing the causal relationships between various medical entities, such as diseases, treatments, confounders, and survival of patients. This graphical and analytical synthesis of knowledge from clinical texts using DAG is crucial for promoting clinical decision-making and understanding of causal variables' interactions in clinical care. The overarching objective of testing the causal diagram or knowledge discovered is to confirm or reject the assumptions identified and encoded in the Causal graph ontological framework. The CIT metrics, as provided by [16], show that our patient survival assumption based on data in the clinical discharge dataset is based on the CIT validation results. Therefore, it is logical to suggest that our initial causal assumption: Diseases ⊥ Survival_rate | Confounders, Treatment in our causal model estimation which is interpreted as Diseases is independent of Survival_rate given or conditioned on Confounders and Treatment should be correct for patient survival estimation and medical decision reasoning.
Moreover, we further carried out a sensitivity analysis on the covariates to uncover the contributions of the variables on the target variable and identify biases in the dataset using Shapley values. Our experiment showed that variables such as diseases and gender contributed the least to the prediction, as shown in Figure 7. However, the predictive accuracy of the model reduced from 93.90% to 91.91% when we removed the assumed biased variables such as gender and diseases. Therefore, the result of our research further suggested that those variables contributed to the prediction, though estimated to be small compared to the other variables.
5. CONCLUSION
The construction of causal graphs from clinical texts involves a series of approaches that integrate text analysis and causal knowledge graph methodologies. The ongoing research in this domain aims to refine these techniques to improve the accuracy and utility of causal graphs in clinical settings. The application of causal graph design and validation for variable selection in clinical settings is crucial to delineating important variables in ever-growing electronic health records to make causal clinical decisions. However, computational complexity must be considered in model design, validation analysis, and potential variable biases in the framework. For future studies, this study suggests the data from the causal graph assumption validated in this study can be simulated as a synthetic dataset to predict patient survival rates prediction in clinical text using other natural language predictive algorithms. This will help build predictive models based on causation and not on correlation, which is common in most machine-learning predictive models. Sensitivity analysis should also be conducted to select important causal variables for a causal framework.
DATA AVAILABILITY STATEMENT
The data that support the findings of this study are available at https://healthdata.gov/State/Hospital-Inpatient-Discharges-SPARCS-De-Identified/szqf-xu7c/about_data
CONFLICTS OF INTEREST
The authors declare that they have no conflicts of interest in this work.
REFERENCES
[1] M. bargavi S. K. and S. M., “Artificial Intelligence and Medical Information Modeling,” 2022, pp. 1–11. doi: 10.4018/978-1-6684-4580-8.ch001.
[2] H. Alkattan, S. K. Towfek, and M. Y. Shams, “Tapping into Knowledge: Ontological Data Mining Approach for Detecting Cardiovascular Disease Risk Causes Among Diabetes Patients,” J. Artif. Intell. Metaheuristics, vol. 4, no. 1, pp. 08-15, 2023, doi: 10.54216/JAIM.040101.
[3] G. T. Ayem, A. S. Nsang, B. I. Igoche, and G. Naankang, “Design and Validation of Structural Causal Model: A focus on SENSE-EGRA Datasets,” Int. J. Adv. Sci. Comput. Eng., vol. 5, no. 3, pp. 257–268, Dec. 2023, doi: 10.62527/ijasce.5.3.177.
[4] K. Benson and A. J. Hartz, “A Comparison of Observational Studies and Randomized, Controlled Trials,” N. Engl. J. Med., vol. 342, no. 25, pp. 1878–1886, Jun. 2000, doi: 10.1056/NEJM200006223422506.
[5] J. Yang, S. C. Han, and J. Poon, “A survey on extraction of causal relations from natural language text,” Knowl. Inf. Syst., vol. 64, no. 5, pp. 1161–1186, May 2022, doi: 10.1007/s10115-022-01665-w.
[6] P. W. G. Tennant et al., “Use of directed acyclic graphs (DAGs) to identify confounders in applied health research: review and recommendations,” Int. J. Epidemiol., vol. 50, no. 2, pp. 620–632, May 2021, doi: 10.1093/ije/dyaa213.
[7] H. Lyu et al., “LLM-Rec: Personalized Recommendation via Prompting Large Language Models,” in Findings of the Association for Computational Linguistics: NAACL 2024, Stroudsburg, PA, USA: Association for Computational Linguistics, 2024, pp. 583–612. doi: 10.18653/v1/2024.findings-naacl.39.
[8] M. Piccininni, S. Konigorski, J. L. Rohmann, and T. Kurth, “Directed acyclic graphs and causal thinking in clinical risk prediction modeling,” BMC Med. Res. Methodol., vol. 20, no. 1, p. 179, Dec. 2020, doi: 10.1186/s12874-020-01058-z.
[9] S. Gopalakrishnan, V. Z. Chen, W. Dou, G. Hahn-Powell, S. Nedunuri, and W. Zadrozny, “Text to Causal Knowledge Graph: A Framework to Synthesize Knowledge from Unstructured Business Texts into Causal Graphs,” information, vol. 14, no. 7, p. 367, Jun. 2023, doi: 10.3390/info14070367.
[10] A. Sobrino, C. Puente, and J. Á. Olivas, “Mining Temporal Causal Relations in Medical Texts,” 2018, pp. 449–460. doi: 10.1007/978-3-319-67180-2_44.
[11] G. Nordon, G. Koren, V. Shalev, B. Kimelfeld, U. Shalit, and K. Radinsky, “Building Causal Graphs from Medical Literature and Electronic Medical Records,” Proc. AAAI Conf. Artif. Intell., vol. 33, no. 01, pp. 1102–1109, Jul. 2019, doi: 10.1609/aaai.v33i01.33011102.
[12] G. Zhao, W. Gu, W. Cai, Z. Zhao, X. Zhang, and J. Liu, “MLEE: A method for extracting object-level medical knowledge graph entities from Chinese clinical records,” Front. Genet., vol. 13, Jul. 2022, doi: 10.3389/fgene.2022.900242.
[13] J. Gao, X. Luo, and H. Wang, “Chinese causal event extraction using causality‐associated graph neural network,” Concurr. Comput. Pract. Exp., vol. 34, no. 3, Feb. 2022, doi: 10.1002/cpe.6572.
[14] I. Y. Chen, M. Agrawal, S. Horng, and D. Sontag, “Robustly Extracting Medical Knowledge from EHRs: A Case Study of Learning a Health Knowledge Graph,” in Biocomputing 2020, WORLD SCIENTIFIC, Dec. 2019, pp. 19–30. doi: 10.1142/9789811215636_0003.
[15] H. Wu, W. Shi, and M. D. Wang, “Developing a novel causal inference algorithm for personalized biomedical causal graph learning using meta machine learning,” BMC Med. Inform. Decis. Mak., vol. 24, no. 1, p. 137, May 2024, doi: 10.1186/s12911-024-02510-6.
[16] M. C. Vonk, N. Malekovic, T. Bäck, and A. V. Kononova, “Disentangling causality: assumptions in causal discovery and inference,” Artif. Intell. Rev., vol. 56, no. 9, pp. 10613–10649, Sep. 2023, doi: 10.1007/s10462-023-10411-9.
[17] A. Ankan, I. M. N. Wortel, and J. Textor, “Testing Graphical Causal Models Using the R Package ‘dagitty,’” Curr. Protoc., vol. 1, no. 2, Feb. 2021, doi: 10.1002/cpz1.45.
[18] D. Valizade, F. Schulz, and C. Nicoara, “Towards a Paradigm Shift: How Can Machine Learning Extend the Boundaries of Quantitative Management Scholarship?,” Br. J. Manag., vol. 35, no. 1, pp. 99–114, Jan. 2024, doi: 10.1111/1467-8551.12678.
[19] R. Pryzant, D. Card, D. Jurafsky, V. Veitch, and D. Sridhar, “Causal Effects of Linguistic Properties,” in Proceedings of the 2021 Conference of the North American Chapter of the Association for Computational Linguistics: Human Language Technologies, Stroudsburg, PA, USA: Association for Computational Linguistics, 2021, pp. 4095–4109. doi: 10.18653/v1/2021.naacl-main.323.
[20] M. Hussain et al., “A practical approach towards causality mining in clinical text using active transfer learning,” J. Biomed. Inform., vol. 123, p. 103932, Nov. 2021, doi: 10.1016/j.jbi.2021.103932.
[21] D. Sridhar and D. M. Blei, “Causal inference from text: A commentary,” Sci. Adv., vol. 8, no. 42, Oct. 2022, doi: 10.1126/sciadv.ade6585.
[22] A. Molak, “Causal Inference and Discovery in Python: Unlock the secrets of Modern Causal Machine Learning with DoWhy, EconML, PyTorch, and More,” Packt Publ. Ltd, 2023.
[23] K. Yu et al., “Causality-based Feature Selection,” ACM Comput. Surv., vol. 53, no. 5, pp. 1–36, Sep. 2021, doi: 10.1145/3409382.
[24] B. I. Igoche, O. Matthew, P. Bednar, and A. Gegov, “Integrating Structural Causal Model Ontologies with LIME for Fair Machine Learning Explanations in Educational Admissions,” J. Comput. Theor. Appl., vol. 2, no. 1, pp. 65–85, Jun. 2024, doi: 10.62411/jcta.10501.
[25] S. Tang et al., “Data valuation for medical imaging using Shapley value and application to a large-scale chest X-ray dataset,” Sci. Rep., vol. 11, no. 1, p. 8366, Apr. 2021, doi: 10.1038/s41598-021-87762-2.
BIOGRAPHIES OF AUTHORS

Omachi Okolo is a PhD student at the Department of Information Technology, Faculty of Computing at the Modibbo Adama University Yola, Nigeria. He received a master's degree from the same department in 2019 and a Bachelor's degree from the Federal University of Technology Minna, Nigeria, in 2007. He works at the American University of Nigeria in Yola, Nigeria. His research interests are machine learning, causal learning, health informatics, and information and digital literacy. He can be reached through email at omachi.okolo@gmail.com.

B. Y. Baha is a Professor of Computer science (Artificial Intelligence). He received a Bachelor of Technology (B.Tech) in Computer Science from the Abubakar Tafawa Balewa University (ATBU) Bauchi, an M.Sc. in Computer Science from the Ahmadu Bello University (ABU) Zaria, and a PhD in Computer Science from the Modibbo Adama University in Yola. He has over 20 years of teaching and research experience, and he is a member of various professional associations such as MCPN, MNCS, MAITP, MTRCN, and AITP. He is currently the Provost of Adamawa State College of Education, Hong, Adamawa State, Nigeria. He can be reached through email at bybaha@gmail.com.

M.D Philemon is a lecturer in the Department of Information Technology at the Modibbo Adama University Yola. He obtained his Ph.D. from the Department of Mathematical Sciences, University of Technology Johor, Malaysia. He obtained his Bachelor's and Master's degrees in Operation research from the Modibbo Adama University, Yola. He is a prolific author with various publications in mathematical and predictive modelling. He can be reached through email at dpmanliura@gmail.com.